The Front-End Tooling Survey 2019 - Results
It's been a little while coming, but the results from the 2019 Front-End Tooling Survey are now here!
This year, 3,005 developers answered 27 questions covering a wide range of front-end tools and methodologies. As always, a massive thank you from me to every single person that took the time to fill it in. Organising and writing up the survey has been especially challenging this year with the addition of a baby girl to our family (thus the delay in these results!).
As always it's super interesting to look at what’s changed over the last 12 months in front-end tooling and see if our thoughts and opinions are shared by other developers in the industry. These results (hopefully) help give an insight into the current usage trends and knowledge levels across front-end tools, as well as showing how these are changing over time by looking at the figures from previous surveys.
Quick Thanks
This survey takes a lot of time to put together each year and is made possible due to the support of Wes Bos (through affiliation with the survey) and my employer, Just Eat.
Wes is renowned for creating awesome learning materials for web developers. Whether you’re just starting out in web development, or an experienced developer looking to level-up your skillset, I'd highly recommend checking out Wes' courses. You'll also find links to Wes' courses where relevant throughout the results.
The results
So, let's get to it! Grab yourself a tea || coffee || beverage of your choice and let’s take a look over the results…
Pre-amble Disclaimer
These results represent a sample of front-end developers working in the industry. Therefore, they shouldn’t be taken as gospel, simply as pointing towards a rough trend.
The responses
As mentioned above, this year's survey received 3,005 responses. This is down a little from last years survey which received 5,461 responses.
I found it a little more difficult to publicise the survey this year, possibly due to there being an increasing number of web development survey’s out there, but also due to the amount of personal time I could spend trying to get the word out there. All things considered though, over 3,000 responses is still incredible.
In terms of where this year's responses may have come from, the link to the survey was posted on Twitter, Reddit, HackerNews, DesignerNews, Echo.js, LinkedIn and Frontendfront. It was also featured by a number of newsletters – FrontEnd Focus and CSS Weekly among others.
Where possible, you'll see that I've included the percentage change from the 2018 survey alongside this year's figures.
Question Index
- General Front-end Experience
- CSS Knowledge Levels
- CSS Processor Usage
- CSS Processor Experience
- CSS Framework Usage
- CSS Naming Schemes
- CSS Linting
- CSS Tool Experience
- CSS Methodologies and Naming Scheme Experience
- CSS Tool Usage
- CSS-in-JS Usage
- CSS Feature Usage
- JavaScript Knowledge Levels
- Task Runners
- Knowledge of JavaScript Libraries and Frameworks
- Most frequently used JS frameworks/libraries
- Most essential JS framework/library
- JavaScript Module Bundler Usage
- JavaScript Module Bundlers & Task Runners experience
- JavaScript Transpilers
- JavaScript Extension Languages
- JavaScript Linting
- JavaScript Testing
- Performance Tools & Features
- Accessibility Tools
- JavaScript Package Managers
- Miscellaneous Tools
Q1 – General Front-end Experience
The first question in the survey was used to find out the amount of front-end experience each respondent has.
The question asked was – Roughly how long have you been working with front-end technologies?
Here are the results:
| Answer | Number of Votes | Percentage |
|---|---|---|
| 0-1 Year | 91 | 3.03% |
| 1-2 Years | 279 | 9.28% |
| 2-5 Years | 859 | 28.59% |
| 5-10 Years | 860 | 28.62% |
| 10-15 Years | 503 | 16.74% |
| Over 15 Years | 413 | 13.74% |
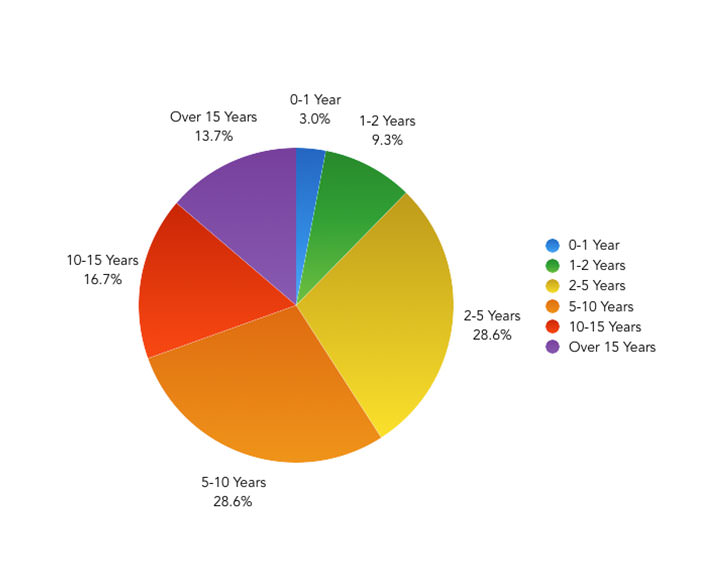
59.1% of respondents have been working with front-end technologies for over 5 years. This is up slightly from last year's results (54.18%), so this year's respondents have slightly more experience with front-end technologies. However it's worth noting that this could be partly explained by a number of respondents also having participated in last year's survey, and will now (naturally) have more experience.
Just 12.31% of respondents said that they had less than 2 years experience.
As with previous surveys, a clear majority of respondents have a fairly high level of experience in front-end technologies. It's worth taking this into account when considering the rest of the survey results.
Q2 – CSS Knowledge
The second question looked at how respondents rated their own knowledge of CSS, asking – How do you rate your own knowledge of CSS and its associated tools and methodologies?
Here’s what the responses looked like:
| Level | Number of Votes | Percentage |
|---|---|---|
| Beginner | 35 | 1.16% |
| Novice (between Beginner and Intermediate) | 243 | 8.09% |
| Intermediate | 815 | 27.12% |
| Advanced (between Intermediate and Expert) | 1452 | 48.32% |
| Expert | 460 | 15.31% |
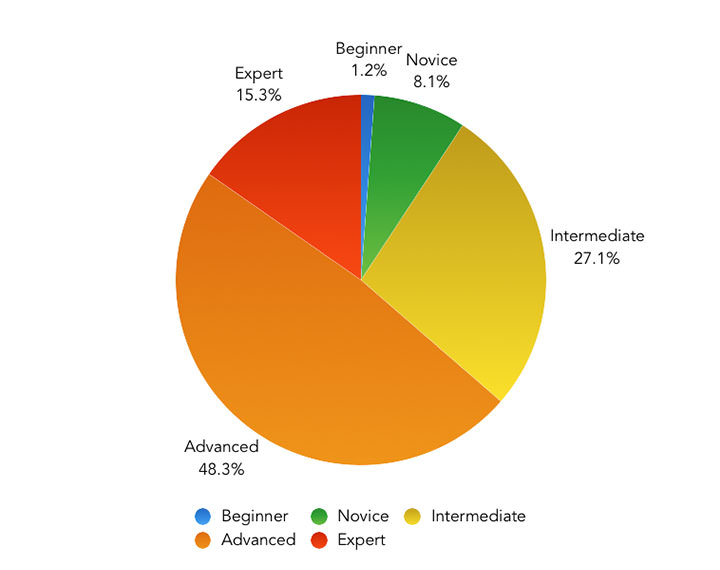
90.75% of respondents stated that their knowledge in CSS is at an intermediate level or above, with a majority (63.63%) rating themselves as either Advanced or an Expert.
As I mention every year, any question regarding broad knowledge levels like this is very subjective to the respondent. One person's idea of what it takes to be an expert in CSS could vary a huge amount to what another person thinks.
Irrespective of this, it's useful to be able to filter these knowledge levels against the results of other questions in the survey – for example to see if more experienced developers favour certain tools over those that beginners may use. I'll refer back to these results where appropriate in future questions.
Q3 – CSS Processor Usage
Our first question on CSS Tooling was in relation to CSS processing tools.
In previous years, this question asked respondents to select their favoured CSS Preprocessing Tool. This year, the question was changed slightly to allow respondents to select multiple tools, asking Which of these CSS Processors do you regularly use?
Since the survey began back in 2016, Sass has been the dominant tool in this area, so has anything changed this year?
N.b. I've included a comparison to last years figures, but it's important to consider that respondents are now able to select multiple responses instead of just one. The results are therefore likely to show at least a small rise in usage across all tools.
| Preprocessor | Number of Votes | Percentage | % Diff (to 2018) |
|---|---|---|---|
| Sass | 2,322 | 77.27% | +11.88% |
| PostCSS | 863 | 28.72% | +20.06% |
| Less | 422 | 14.04% | +7.52% |
| No Preprocessor | 395 | 13.14% | -1.44% |
| Stylus | 98 | 3.26% | +1.08% |
| Other | 80 | 2.66% | -0.01% |
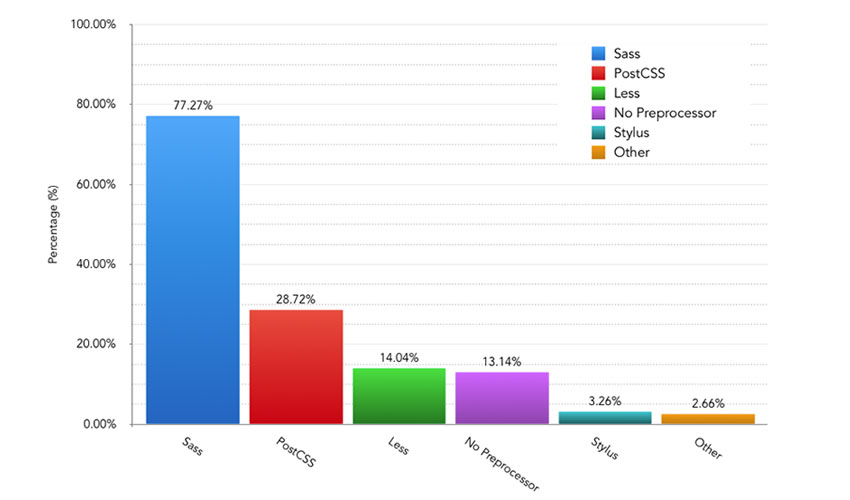
As in previous years, Sass is still very much the dominant CSS Processing tool being used by developers, with 77.27% of respondents saying that they used it.
Interestingly, PostCSS is now the second most used tool, with 28.72% of respondents using it. Respondents now being able to choose multiple tools has clearly helped to give a more accurate representation of PostCSS usage, with PostCSS often used in addition to a tool such as Sass.
Q4 – CSS Processor Experience
The next question followed on from the previous one, with respondents asked to indicate their experience levels across CSS processing tools.
Here are the results:
| Never Heard of | Heard of/Read About | Used a little | Feel Comfortable Using | |||||
|---|---|---|---|---|---|---|---|---|
| Sass – Standard or SCSS syntax | 0.33% (10) | +0.13% | 6.82% (205) | -2.17% | 15.34% (461) | -2.61% | 77.50% (2,329) | +4.64% |
| Less | 1.40% (42) | +0.21% | 35.81% (1,076) | -0.52% | 35.34% (1,062) | +1.10% | 27.45% (825) | -0.79% |
| Stylus | 21.06% (633) | -1.70% | 61.93% (1,861) | +1.56% | 11.35% (341) | +0.47% | 5.66% (170) | -0.33% |
| PostCSS | 15.44% (464) | -1.99% | 41.30% (1,241) | -4.06% | 22.73% (683) | +1.98% | 20.53% (617) | +4.07% |
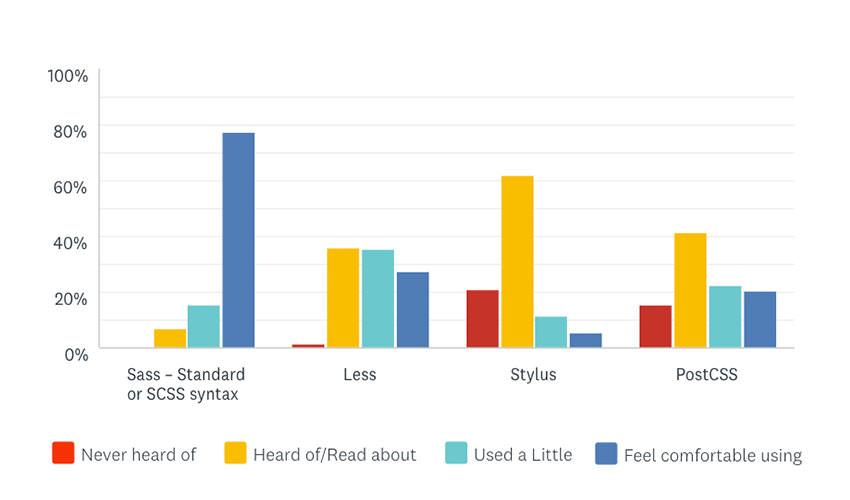
These results are in-line with the results to the previous question, with more than three quarters of respondents (77.50%) saying that they felt comfortable using Sass while just 7.15% said that they had never used it.
PostCSS knowledge levels rose against last years results as 20.53% of respondents said that they felt comfortable using the tool.
Less and Stylus knowledge levels look to be fairly stagnent when compared to last years results.
It's clear looking at the results from Questions 3 and 4 that Sass is still the dominant tool when it comes to CSS Processing.
Q5 – CSS Frameworks
The next question looked at CSS Framework usage, with respondents asked to Please indicate which of the following CSS frameworks you use most frequently on your projects (if any).
Last year saw Bootstrap as the leader in this category, but has this changed 12 months on?
Let’s look at the results:
| Answer | Number of Votes | Percentage | % Diff (to 2018) |
|---|---|---|---|
| No Framework | 1,054 | 35.07% | +2.15% |
| Bootstrap | 840 | 27.95% | -7.01% |
| Custom Framework | 497 | 16.54% | +1.29% |
| Tailwind CSS | 129 | 4.29% | N/A |
| Bulma | 96 | 3.19% | +0.75% |
| Foundation | 79 | 2.63% | -1.31% |
| Materialize | 72 | 2.40% | -0.24% |
| Semantic UI | 63 | 2.10% | +0.16% |
| Tachyons | 25 | 0.83% | N/A |
| PureCSS | 18 | 0.60% | -0.10% |
| Other | 132 | 4.39% | -0.83% |
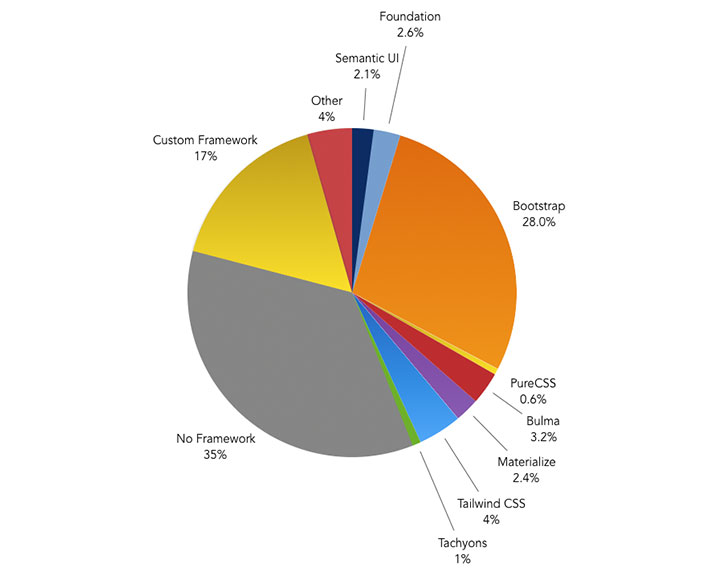
In a change from last years results, the most popular answer – with just over a third of the responses (35.07%) – was from those developers that said that they didn't use any framework.
Although no longer the top response in this question, Bootstrap was still the most popular CSS framework, with 27.95% of respondents using it. This was a fall of 7.01% in comparison to last years results.
Behind Bootstrap, the next most popular CSS Framework was Tailwind CSS.
Showing a similar trend to last years results, there was a clear difference when looking at the usage of CSS frameworks set against CSS knowledge levels. For example, developers who said that they were at Beginner or Novice CSS level were more likely to use Bootstrap (43.17%) than developers who stated that they were either Advanced or Expert level developers (23.69%).
There was also a clear (but arguably, expected) disparity across knowledge levels when looking at the usage of custom CSS frameworks. Overall, 16.54% of respondents said that they used a Custom Framework. This fell to 8.63% of respondents when looking at those respondents who said that they were at a Beginner or Novice level of CSS, whereas this rose to 20.35% when looking at developers with Advanced or Expert knowledge of CSS.
Overall though, it looks like the usage of off-the-shelf CSS Frameworks is down slightly in comparison to last years results.
Q6 – CSS Naming Schemes
The next question in the survey asked respondents – Do you use a CSS naming scheme when writing CSS – such as BEM or SUIT?.
The responses were as follows:
| Answer | Number of Votes | Percentage | % Diff (to 2018) |
|---|---|---|---|
| Yes | 1,565 | 52.08% | +3.15% |
| No – I’ve heard of CSS naming schemes but don’t use one | 1,153 | 38.37% | -0.76% |
| No – I’ve never heard of CSS naming schemes | 287 | 9.55% | -2.39% |
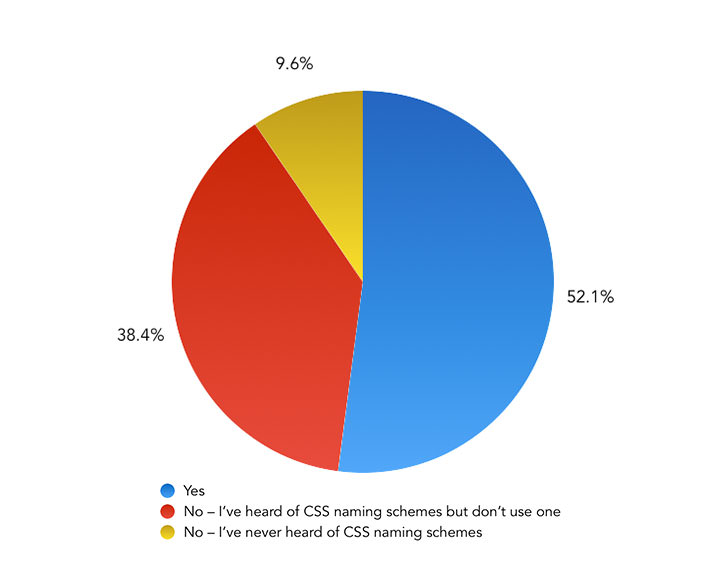
For the first time since the survey started asking developers about CSS naming schemes back in 2016, a majority – 52.08% – responded that they use a CSS naming scheme, up +3.15% from last years results.
The number of developers who had never heard of CSS naming schemes also fell to 9.55%, a difference of -2.39% from a year ago.
From these results, it's clear that usage levels in this area of tooling is still rising, with developers not using a CSS naming scheme now in the minority.
Q7 – CSS Linting
Usage of CSS Linters has been gradually growing since we started asking respondents about the subject back in 2016.
Last year, a majority of developers (50.56%) were still choosing not to lint their CSS, so it'll be interesting to see if this dynamic has changed a year on.
The question asked was – Do you use a tool to lint your CSS?
Here are the results:
| Answer | Number of Votes | Percentage | % Diff (to 2018) |
|---|---|---|---|
| Yes | 1,599 | 53.21% | +3.77% |
| No – I don’t lint my CSS | 1,406 | 46.79% | -3.77% |
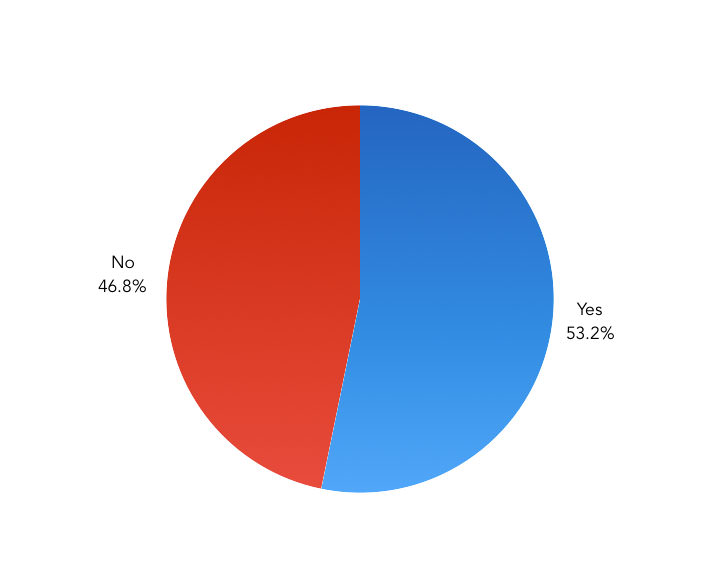
As with CSS Naming Schemes, the results show that for the first time a majority of respondents (53.21%) are now choosing to lint their CSS, up +3.77% from the number that said the same in last years survey.
It's also clear from the results that more advanced CSS developers are more likely to be linting their CSS. Just 28.42% of those with Beginner or Novice CSS knowledge said that they use a CSS linter, compared with 60.15% of those with Advanced CSS knowledge or higher.
CSS linting is steadily on the rise among developers as great tools like Stylelint become more widely known (as we'll look at in the next question).
Q8 – CSS Tool Experience
The next four questions cover knowledge and usage levels across a number of different CSS methodologies and helper tools.
Firstly, Question 8 asked for respondents to state their experience with Autoprefixer, Modernizr and Stylelint.
The results were as follows:
| Never Heard of | Heard of/Read About | Used a little | Feel Comfortable Using | |||||
|---|---|---|---|---|---|---|---|---|
| Autoprefixer | 16.71% (502) | -0.81% | 15.17% (456) | -1.93% | 17.60% (529) | +0.64% | 50.52% (1,518) | +2.10% |
| Modernizr | 12.51% (376) | +1.45% | 28.99% (871) | +1.83% | 34.48% (1,036) | +0.22% | 24.03% (722) | -3.49% |
| Stylelint | 37.74% (1,134) | -6.46% | 24.86% (747) | -1.01% | 14.38% (432) | +2.33% | 23.03% (692) | +5.16% |
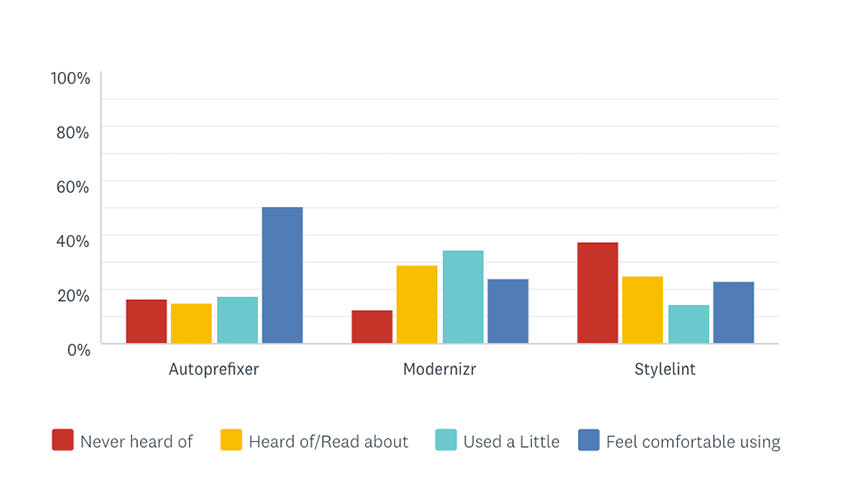
Out of the three tools, Autoprefixer was the most well known, with 50.52% of developers responding that they feel comfortable using it.
Stylelint knowledge levels rose the most over the last 12 months, with 23.03% of developers now feeling comfortable using the tool – a gain of +5.16%.
Modernizr knowledge levels fell a small amount, with the number of respondents saying that they had never heard of it rising and the number who said they felt comfortable using it falling (a drop of -3.49%, to 24.03%).
Q9 – CSS Methodologies and Naming Scheme Experience
Following on from the previous question, respondents were asked – Please indicate your experience with the following CSS methodologies.
The results were as follows:
| Never Heard of | Heard of/Read About | Used a little | Feel Comfortable Using | |||||
|---|---|---|---|---|---|---|---|---|
| CSS-in-JS | 7.72% (232) | -4.59% | 39.43% (1,185) | -2.14% | 25.32% (761) | -0.88% | 27.52% (827) | +7.60% |
| SMACSS | 40.27% (1,210) | -0.86% | 39.13% (1,176) | +0.07% | 12.71% (382) | +0.99% | 7.89% (237) | -0.20% |
| Object Oriented CSS (OOCSS) | 30.22% (908) | -1.77% | 47.29% (1,421) | +2.22% | 14.18% (426) | +0.15% | 8.32% (250) | -0.60% |
| Atomic Design | 27.99% (841) | -5.94% | 40.60% (1,220) | +3.24% | 16.87% (507) | +0.22% | 14.54% (437) | +2.47% |
| ITCSS | 63.89% (1,920) | -5.84% | 24.29% (730) | +3.36% | 5.56% (167) | +1.51% | 6.26% (188) | +0.97% |
| BEM | 13.48% (405) | -2.52% | 22.16% (666) | -3.68% | 20.83% (626) | +0.83% | 43.53% (1,308) | +5.37% |
| SUIT CSS | 68.92% (2,071) | -1.67% | 24.96% (750) | +1.10% | 3.73% (112) | +0.40% | 2.40% (72) | +0.18% |
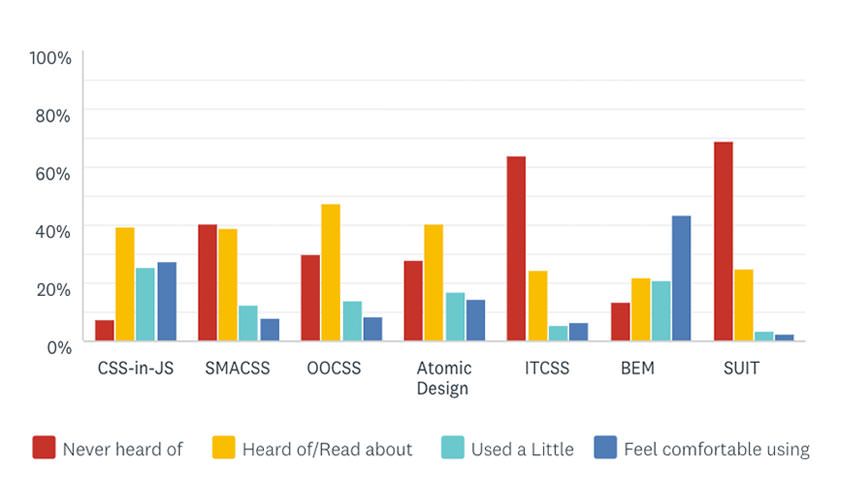
In a slight change to last year's results, most of the CSS methodologies referenced saw slight gains in their knowledge levels.
BEM is still the methodology that the most respondents (43.53%) said they felt comfortable using, a rise of +5.37% from last year's results.
The biggest 12-month gain was seen by CSS-in-JS, with the number of developers now saying that they feel comfortable using it rising by +7.6% to 27.52%.
SMACSS, OOCSS, Atomic Design and ITCSS all saw the number of respondents who had at least heard of them, or used them a little, rise from last year's results, with Atomic Design and ITCSS seeing the most notable gains.
Looking specifically across the CSS architectural methodologies mentioned – so that’s SMACSS, OOCSS, Atomic Design, ITCSS and CSS-in-JS – the percentage of respondents who said that they feel comfortable using at least one of these rose from 34.90% last year to 42.26% in 2019. That's a rise of +7.36%. When looking at those respondents who said that they had used one of these CSS methodologies at least a little, this figure rises to 70.75% – up from 66.49% in 2018.
These results indicate that knowledge levels across CSS methodologies and naming schemes is trending upwards, with BEM, CSS-in-JS and Atomic Design the most well-known in this area.
Q10 – CSS Tool Usage
Continuing the focus on CSS methodologies, Question 10 asked – Which of these CSS methodologies or tools do you currently use on your projects?
Let's take a look at the results.
n.b. CSS-in-JS is omitted from the available answers below, as question 11 focuses solely on CSS-in-JS usage.
| Tool/Methodology | Number of Votes | Percentage | % Diff (to 2018) |
|---|---|---|---|
| Autoprefixer | 1708 | 56.84% | +0.13% |
| BEM | 1368 | 45.52% | +2.01% |
| Stylelint | 826 | 27.49% | +4.71% |
| Modernizr | 634 | 21.10% | -8.24% |
| Atomic Design | 463 | 15.41% | +0.19% |
| Object Oriented CSS (OOCSS) | 218 | 7.25% | -1.98% |
| SMACSS | 173 | 5.76% | -0.89% |
| ITCSS | 155 | 5.16% | +0.36% |
| SUIT CSS | 46 | 1.53% | +0.03% |
| I don’t use any of these approaches or tools | 664 | 22.10% | +5.18% |
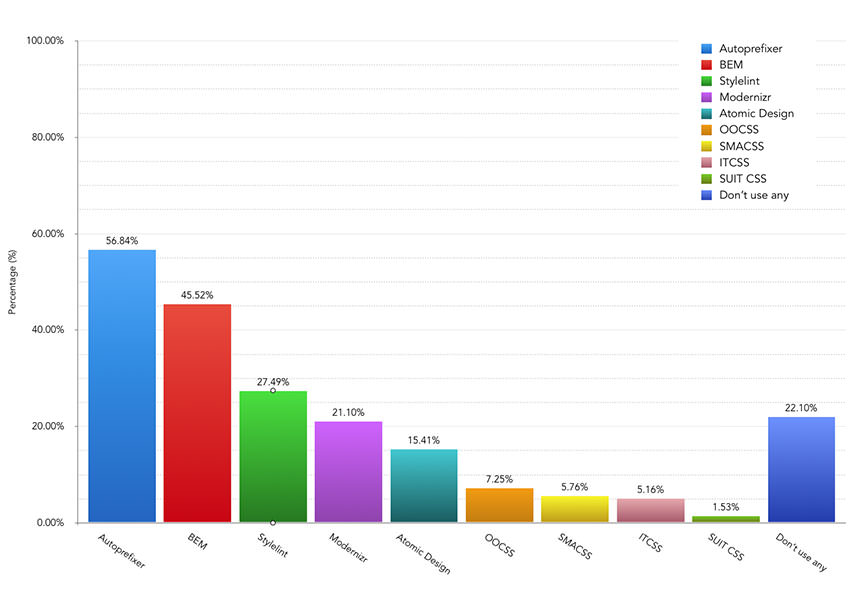
Autoprefixer saw the most usage out of these tools and methodologies (56.84%), followed by BEM (45.52%) and Stylelint (27.49%). These figures were all a slight increase from the 2018 results, with Stylelint seeing the biggest gain with +4.71%.
Modernizr usage fell by -8.24% over the last 12 months to 21.10%, continuing its downward trend in usage that was observed in last years results.
Although knowledge levels of CSS methodologies appear to have grown slightly, their usage levels have stayed fairly similar to those seen in 2018. Atomic Design is still the most popular CSS design methodology with 15.41% of developers using it.
Overall, these figures suggest that it has been a year of consolidation in this area from 2018.
Q11 – CSS-in-JS Usage
The next question is a new question for this year's survey and asks about an area that has seen a lot of interest recently – CSS-in-JS.
The number of developers using CSS-in-JS tools has grown to such a point where it'll be interesting to see which tools are the most popular in this space.
So the question asked was – What is your preferred CSS-in-JS tool?
| Tool/Methodology | Number of Votes | Percentage |
|---|---|---|
| I don't use CSS-in-JS on my projects | 1,662 | 55.31% |
| Styled Components | 812 | 27.02% |
| CSS Modules | 292 | 9.72% |
| Emotion | 119 | 3.96% |
| JSS | 50 | 1.66% |
| Aphrodite | 10 | 0.33% |
| Radium | 1 | 0.03% |
| Other | 59 | 1.96% |
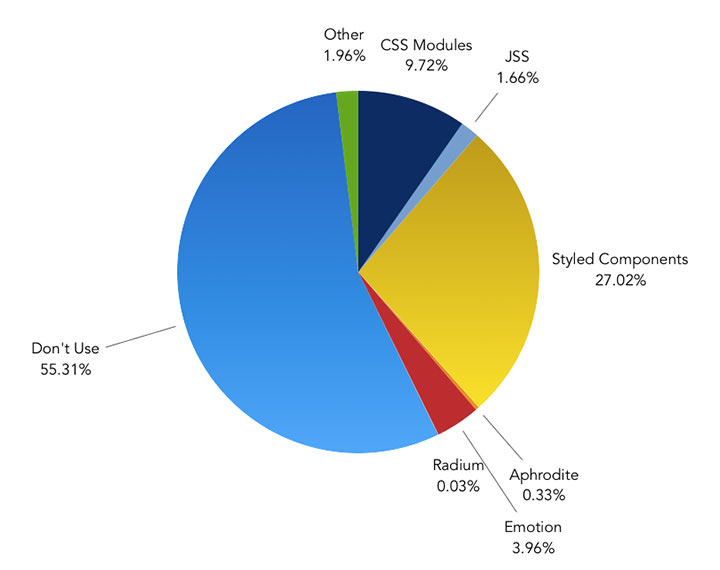
44.69% of respondents said that they now use a CSS-in-JS tool, with the most popular option being Styled Components (27.02%). CSS Modules (9.72%) and Emotion (3.96%) were the next most popular tools with developers.
The majority of developers (55.31%) responded that they don't use a CSS-in-JS tool. This is still a relatively new area of tooling and given that it is specialised for certain use-cases, it's unsurprising to see that that is the case.
As you may expect, when filtering by developers who said that they had advanced or expert JS skills, the percentage of respondents using a CSS-in-JS tool rose to 51.38%. This is perhaps unsurprising, given that CSS-in-JS is generally used in combination with a JavaScript framework.
Overall, it's clear that CSS-in-JS is becoming an important part of many developers toolkits. It'll be interesting to see how these figures change in the future.
Q12 – CSS Feature Usage
The final CSS related question focused on respondents' knowledge of recent CSS features.
With so much being written and talked about with respect to the latest CSS features, it's always interesting to find out how many developers have started to put these features into practice and gained experience using them.
Therefore, respondents were asked to – Please indicate your experience with the following CSS features.
Here are the results:
| Never Heard of | Heard of/Read About | Used a little | Feel Comfortable Using | |||||
|---|---|---|---|---|---|---|---|---|
| CSS Grid | 0.90% (27) | -0.33% | 21.90% (658) | -14.47% | 48.62% (1,461) | +4.69% | 28.59% (859) | +10.11% |
| Flexbox | 0.43% (13) | -0.25% | 2.50% (75) | -3.29% | 16.67% (501) | -9.28% | 80.40% (2,416) | +12.81% |
| CSS Custom Properties | 8.95% (269) | -1.18% | 30.58% (919) | -14.06% | 32.58% (979) | +6.38% | 27.89% (838) | +8.86% |
| CSS Houdini | 51.75% (1,555) | N/A | 46.46% (1,396) | N/A | 1.56% (47) | N/A | 0.23% (7) | N/A |
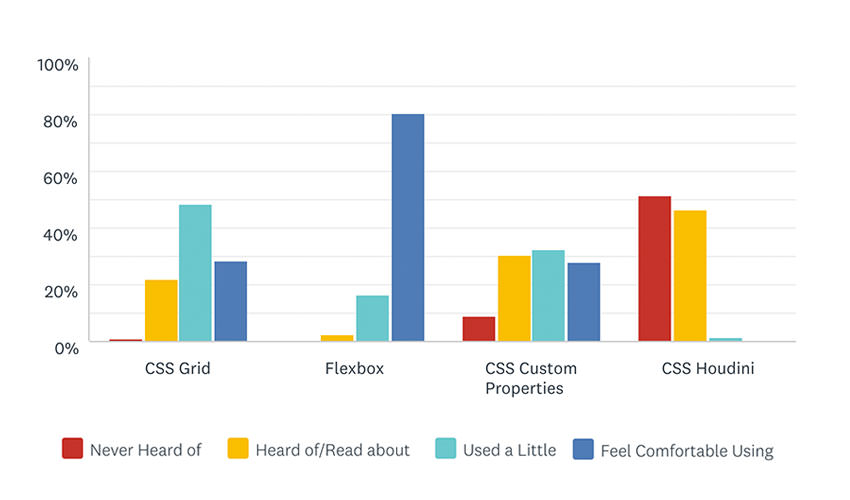
Flexbox (up +12.81% to 80.40%), CSS Grid (up +10.11% to 28.59%) and CSS Custom Properties (up +8.86% to 27.89%) have all seen a rise in the number of developers that now feel comfortable using them.
Almost all developers questioned have now used Flexbox, with 97.07% of respondents saying that they had used it at least a little (this figure was 93.53% in 2018). It's safe to say that Flexbox knowledge is now expected of all front-end developers.
CSS Grid and CSS Custom Properties both saw large swings in the number of respondents moving from having heard of or read about them to having used the feature at least a little. Knowledge in these features still looks like it is growing, with more respondents saying that they've used them a little, than those who feel comfortable using them.
CSS Houdini – a set of APIs that help developers extend CSS natively – was asked about for the first time this year. 46.46% of respondents said that they had heard of or read about the feature, but only 1.79% had used it at least a little. This feature is still bleeding edge, so it's perhaps unsurprising to see so few developers using it presently.
Q13 – JavaScript Knowledge
Moving onto the second half of the survey, the questions now focussed on JavaScript and its ecosystem of tools.
Firstly, I asked respondents – How do you rate your own knowledge of JavaScript and its associated tools and methodologies?
These were the results:
| Knowledge | Number of Votes | Percentage |
|---|---|---|
| Beginner | 70 | 2.33% |
| Novice (between Beginner and Intermediate) | 261 | 8.69% |
| Intermediate | 901 | 29.98% |
| Advanced (between Intermediate and Expert) | 1,237 | 41.16% |
| Expert | 536 | 17.84% |
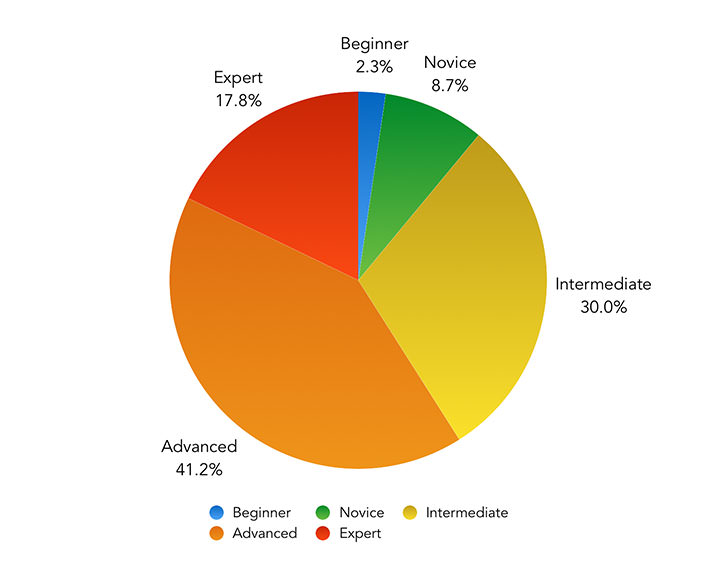
Most respondents considered themselves at least at Intermediate level or higher (88.98%), with the majority saying that they were Advanced or Expert (59.0%).
It would be wrong to say that this is a reflection of knowledge levels across the whole of our industry – it's more likely just a reflection of the knowledge levels of those taking a survey like this one. As you might expect within this context, the weighting is more towards the advanced end of the spectrum.
Q14 – Task Runners
Last year saw usage of NPM Scripts move ahead of Gulp by quite some margin. Have they consolidated their position 12 months on?
The question that respondents were asked was – What task runner do you prefer using in your typical project workflow?
| Task Runner | Number of Votes | Percentage | % Diff (to 2018) |
|---|---|---|---|
| NPM Scripts | 1,933 | 64.33% | +16.44% |
| Gulp | 557 | 18.54% | -11.02% |
| Don’t use one | 273 | 9.08% | -1.61% |
| Grunt | 76 | 2.53% | -3.26% |
| GUI Application (i.e. Codekit) | 30 | 1.00% | -0.04% |
| Make | 21 | 0.70% | +0.06% |
| Other | 115 | 3.83% | -0.56% |
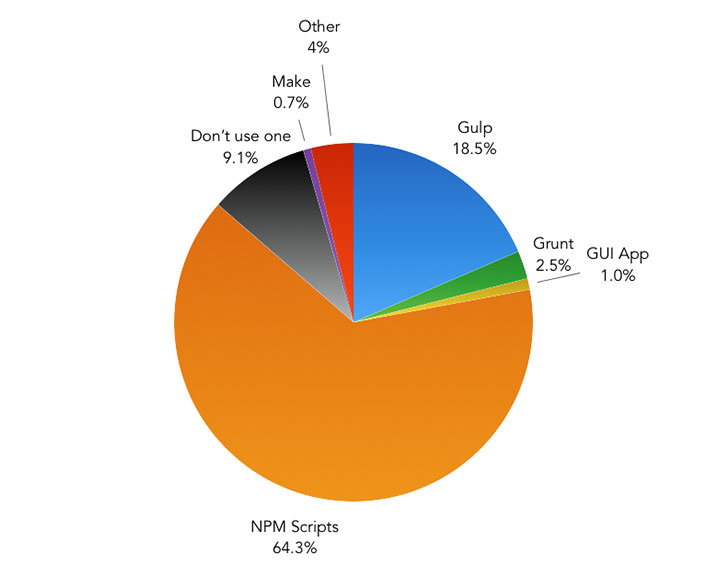
It's clear from these results that NPM Scripting has firmly consolidated its position in this category. 64.33% of respondents said that they now use them – that's a gain of 16.44% on last year's figures.
Usage of almost all other tools in this category fell, with 18.54% of developers using Gulp (a fall of -11.02%) and just 2.53% of developers using Grunt (a fall of -3.26%).
9.08% of respondents said that they didn't use a task runner, although this percentage is down -1.61% from last year's results.
So the trend seems to be following on from last year's results, with developers steadily migrating away from Gulp and Grunt, to be replaced by NPM Scripts in their workflows.
Q15 – Knowledge of JavaScript Libraries and Frameworks
In the following three questions, we asked respondents about their knowledge and usage levels of JavaScript libraries and frameworks.
Last year, React, Vue and Angular 2+ saw the largest gains in knowledge levels. jQuery was still the tool that most developers felt comfortable using, but its actual usage level dipped substantially.
This question looks at knowledge levels across the tools, asking respondents to indicate which JavaScript libraries and frameworks they have experience in.
Here are the results:
| Never Heard of | Heard of/Read About | Used a little | Feel Comfortable Using | |||||
|---|---|---|---|---|---|---|---|---|
| jQuery | 0.03% (1) | -0.08% | 2.80% (84) | +0.49% | 21.80% (655) | +3.95% | 75.37% (2,265) | -4.36% |
| Lodash | 8.09% (243) | -3.61% | 22.50% (676) | -3.23% | 28.75% (864) | +3.15% | 40.67% (1,222) | +3.70% |
| Underscore | 12.58% (378) | +0.09% | 32.58% (979) | -2.34% | 26.39% (793) | +1.98% | 28.45% (855) | +0.27% |
| React | 0.27% (8) | -0.11% | 24.53% (737) | -6.62% | 26.86% (807) | -1.18% | 48.35% (1,453) | +7.92% |
| Vue.js | 0.43% (13) | -0.6% | 50.18% (1,508) | -8.86% | 26.19% (787) | +3.32% | 23.19% (697) | +6.12% |
| Angular 1 | 0.57% (17) | -0.07% | 50.75% (1,525) | +3.43% | 29.85% (897) | -0.29% | 18.84% (566) | -3.06% |
| Angular 2+ | 0.40% (12) | -0.30% | 63.73% (1,915) | -1.31% | 20.07% (603) | -1.41% | 15.81% (475) | +3.03% |
| Ember | 5.49% (165) | +1.04% | 79.03% (2,375) | -1.52% | 8.22% (247) | -0.22% | 7.25% (218) | +0.69% |
| Preact | 21.30% (640) | -2.30% | 65.02% (1,954) | -0.26% | 9.08% (273) | +2.41% | 4.59% (138) | +0.14% |
| Backbone | 8.55% (257) | +1.77% | 65.69% (1,974) | -1.86% | 18.20% (547) | +1.30% | 7.55% (227) | -1.22% |
| Knockout | 23.43% (704) | +2.88% | 62.53% (1,879) | -2.44% | 10.88% (327) | +0.22% | 3.16% (95) | -0.67% |
| Aurelia | 44.79% (1,346) | +3.37% | 51.48% (1,547) | -3.56% | 2.73% (82) | +0.33% | 1.00% (30) | -0.14% |
| MeteorJS | 18.24% (548) | +2.86% | 71.45% (2,147) | -1.91% | 8.95% (269) | -0.33% | 1.36% (41) | -0.62% |
| Polymer | 18.64% (560) | +0.68% | 71.48% (2,148) | +0.58% | 8.39% (252) | -1.10% | 1.50% (45) | -0.15% |
| D3.js | 13.48% (405) | N/A | 49.68% (1,493) | N/A | 29.55% (888) | N/A | 7.29% (219) | N/A |
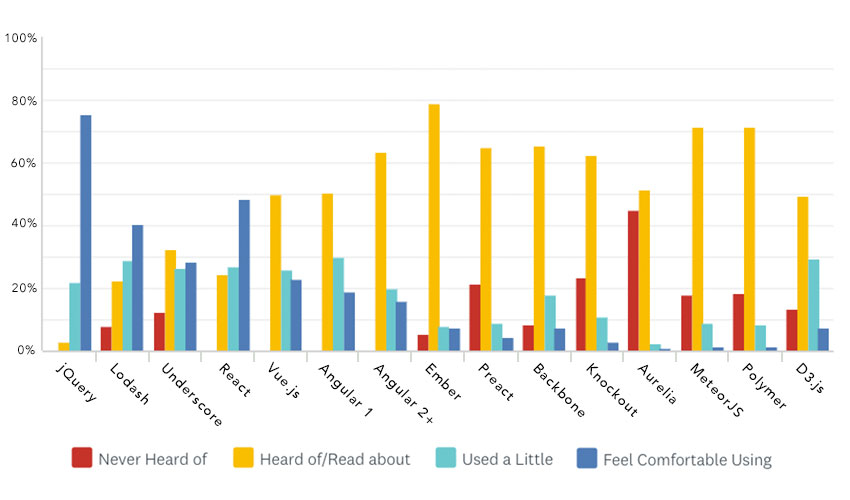
The tools which had the highest number of respondents who said they felt comfortable using them were jQuery (75.37%), React (48.35%), Lodash (40.67%), Underscore (28.45%) and Vue.js (23.19%).
React and Vue were the two tools that saw the biggest gains in the number of developers that felt comfortable using them, with 48.35% saying that they now felt comfortable using React (+7.92% from 2018), and 23.19% saying the same for Vue (+6.12%).
The number of respondents that said the same about jQuery was down slightly to 75.37% (down -4.36% from 2018).
Knowledge levels of Lodash saw a small gain as well, with those using it a little (28.75%) and those that felt comfortable using it (40.67%) up +3.15% and +3.70% respectively.
This year, D3.js was added as an option on this question for the first time, with 7.29% of developers saying they feel comfortable using it.
Looking at knowledge levels across all the JavaScript MV* frameworks – so everything in the list except jQuery, Underscore, Lodash and D3.js – 78.54% of respondents said that they felt comfortable using at least one of these frameworks. That figure is up 8.04% on last year's results, and up 28% since 2016, showing just how important it is for front-end developers to know at least one of these tools.
Q16 – Most frequently used JavaScript tools
Next respondents were asked – Which JavaScript libraries and/or frameworks do you currently use most frequently on projects?
Respondents were invited to select all (or none) of the tools that they use on their projects.
The responses were as follows:
| Number of Votes | Percentage | % Diff (to 2018) | |
|---|---|---|---|
| React | 1,569 | 52.21% | +4.82% |
| jQuery | 1,106 | 36.81% | -14.24% |
| Lodash | 986 | 32.81% | -1.01% |
| Vue.js | 816 | 27.15% | +4.21% |
| Angular (v2+) | 472 | 15.71% | +1.59% |
| D3.js | 267 | 8.89% | N/A |
| Ember | 201 | 6.69% | +0.68% |
| Underscore | 199 | 6.62% | -1.22% |
| AngularJS | 191 | 6.36% | -4.06% |
| Preact | 75 | 2.50% | -0.48% |
| Backbone | 55 | 1.83% | -0.72% |
| Polymer | 35 | 1.16% | -0.58% |
| Knockout | 30 | 1.00% | -0.83% |
| Aurelia | 26 | 0.87% | -0.25% |
| MeteorJS | 24 | 0.80% | -0.57% |
| I don’t use any of these approaches or tools | 120 | 3.99% | +0.38% |
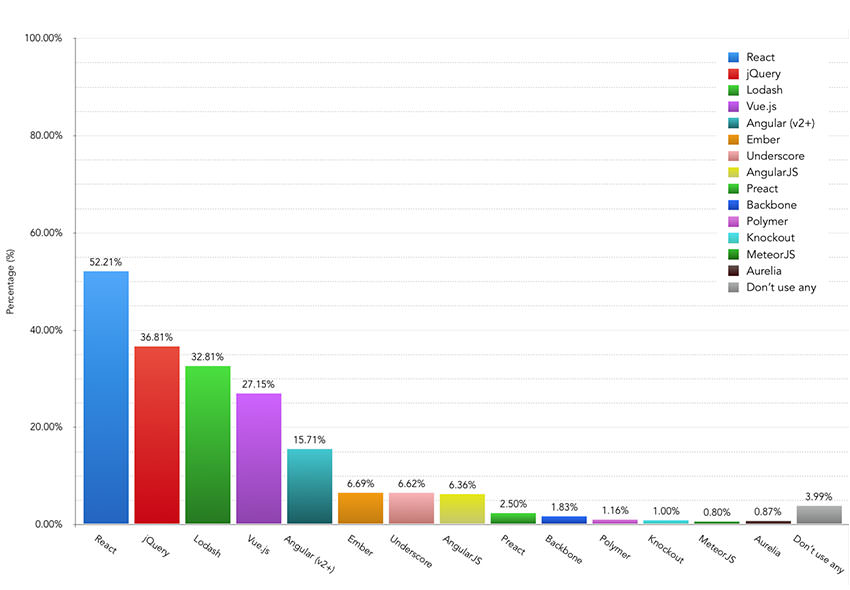
For the first time since the survey started back in 2015, jQuery is no longer the most frequently used JS tool, with React now holding that position.
52.21% of developers said that they use React frequently on their projects, a gain of +4.82% from last years results. 36.81% of respondents said that they used jQuery frequently, which shows a -14.24% drop from last year.
Lodash (32.81%), Vue.js (27.15%) and Angular v2+ (15.71%) were the next most frequently used tools, seeing a change of -1.01%, +4.21% and +1.59% respectively compared with the 2018 results.
Recommended Resource

Q17 – Most essential JavaScript framework/library
The final JS framework question asked respondents – Which JavaScript library or framework would you regard as essential to you on the majority of your projects?
Last year, React gained the biggest share of responses from developers, but has anything changed 12 months on?
Let's take a look:
| Number of Votes | Percentage | % Diff (to 2018) | |
|---|---|---|---|
| React | 985 | 32.78% | +4.31% |
| None of them are essential – I feel comfortable just using native JavaScript on my projects | 651 | 21.66% | +0.05% |
| Vue.js | 404 | 13.44% | +3.22% |
| jQuery | 335 | 11.15% | -8.59% |
| Angular (v2+) | 255 | 8.49% | +2.30% |
| Ember | 167 | 5.56% | +1.17% |
| Lodash | 73 | 2.43% | -0.99% |
| AngularJS | 22 | 0.73% | -0.97% |
| Aurelia | 18 | 0.60% | 0% |
| Backbone | 11 | 0.37% | +0.08% |
| Preact | 8 | 0.27% | 0% |
| Underscore | 7 | 0.23% | -0.19% |
| Polymer | 7 | 0.23% | -0.28% |
| MeteorJS | 4 | 0.13% | -0.05% |
| Knockout | 1 | 0.03% | -0.13% |
| D3.js | 1 | 0.03% | N/A |
| Other (please specify) | 56 | 1.86% | +0.07% |
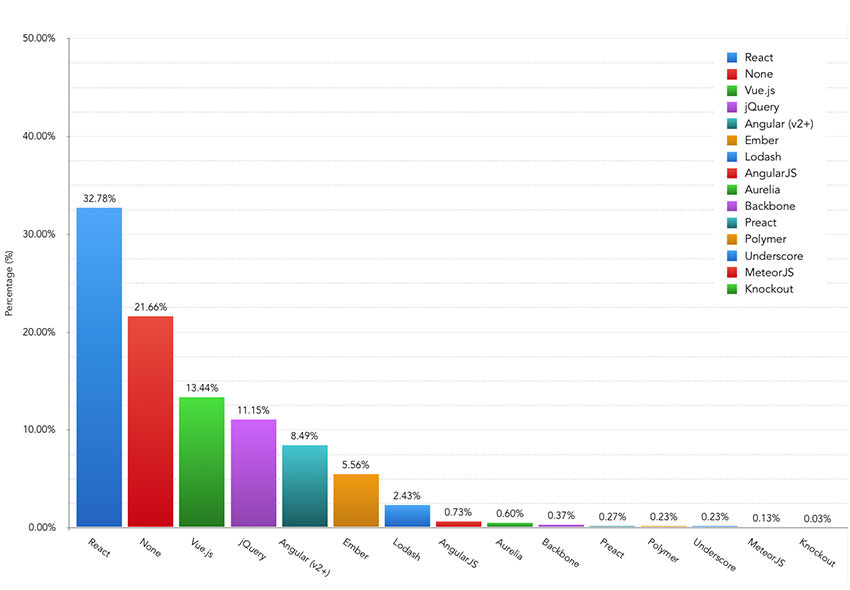
React has consolidated its position in this year's results with 32.78% of respondents saying that they consider it their most essential JavaScript library or framework. This figure is up +4.31% from last year's survey.
21.66% of developers said that they consider no tool as essential to them in this category.
The next most essential tools were Vue.js with 13.44% (up +3.22% from last year), jQuery with 11.15% (down -8.59%) and Angular v2+ with 8.49% (up +2.3%).
When filtering down into experience levels the results get more pronounced. 45.14% of those developers with 0-2 years front-end development experience said that React was essential to them. This figure drops to 24.02% of respondents when looking at those developers with 10+ years experience. 28.06% of developers with that level of experience also say that no library or tool is essential to them.
Overall, looking at the results from all three questions relating to JS libraries and frameworks, React knowledge levels and usage is still growing, with Vue.js clearly the second most popular JavaScript framework (albeit still some way behind React's popularity).
jQuery usage, although falling steadily, is still high – with it still being used frequently by more respondents than Lodash.
Recommended Resource
Q18 – JavaScript Module Bundlers – Usage
For the last couple of surveys, Webpack has been dominant in this category of tooling. So have any tools started to make a dent in its dominance?
The question asked was – Do you use a JavaScript module bundler in your workflow?
Here are the results:
| Module Bundler | Number of Votes | Percentage | % Diff (to 2018) |
|---|---|---|---|
| Webpack | 2,204 | 73.34% | +7.66% |
| I don’t use a module bundler | 440 | 14.64% | -5.91% |
| Parcel | 85 | 2.83% | +1.79% |
| Rollup | 62 | 2.06% | -0.12% |
| Browserify | 49 | 1.63% | -2.09% |
| RequireJS | 37 | 1.23% | -1.32% |
| SystemJS | 3 | 0.10% | N/A |
| Other (please specify) | 125 | 4.16% | +0.15% |
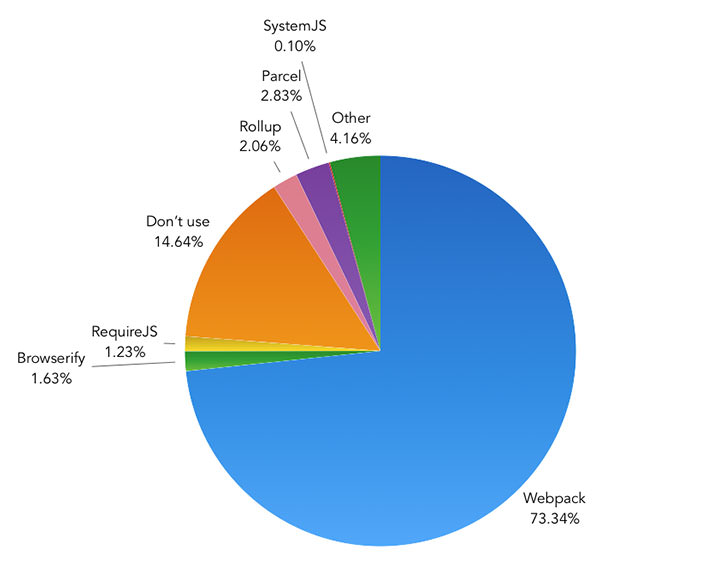
Webpack has continued to grow over the last 12 months, with 73.34% of respondents saying that they use it as their module bundler. That's a +7.66% rise from last year's results.
The next most used modules bundlers were Parcel and Rollup with 2.83% and 2.06% of the responses.
The number of developers saying that they didn't use a module bundler also fell -5.91%, to 14.64% of responses. That means that 85.36% of respondents are now using a module bundler.
As with last year, Webpack is still very much the dominant tool in this area and is showing no sign of it being replaced by an alternative tool in the foreseeable future.
Q19 – JavaScript Module Bundlers & Task Runners – Experience
The next question asked respondents about their experience levels across the module bundlers and task managers previously mentioned.
Here's how the results looked:
| Never Heard of | Heard of/Read About | Used a little | Feel Comfortable Using | |||||
|---|---|---|---|---|---|---|---|---|
| Gulp | 1.66% (50) | +0.21% | 20.33% (611) | +1.34% | 32.21% (968) | +2.20% | 45.79% (1,376) | -3.76% |
| NPM Scripts | 3.13% (94) | -1.23% | 9.15% (275) | -3.59% | 23.33% (701) | -3.42% | 64.39% (1,935) | +8.25% |
| Grunt | 2.93% (88) | +0.68% | 34.51% (1,037) | +1.37% | 37.97% (1,141) | +1.93% | 24.59% (739) | -3.98% |
| Webpack | 2.03% (61) | -0.61% | 13.28% (399) | -6.02% | 32.31% (971) | +0.92% | 52.38% (1,574) | +5.70% |
| Browserify | 11.91% (358) | +2.33% | 52.95% (1,591) | +0.84% | 25.76% (774) | -0.76% | 9.38% (282) | -2.41% |
| Parcel | 30.18% (907) | -15.14% | 49.78% (1,496) | +3.34% | 12.98% (390) | +7.47% | 7.05% (212) | +4.32% |
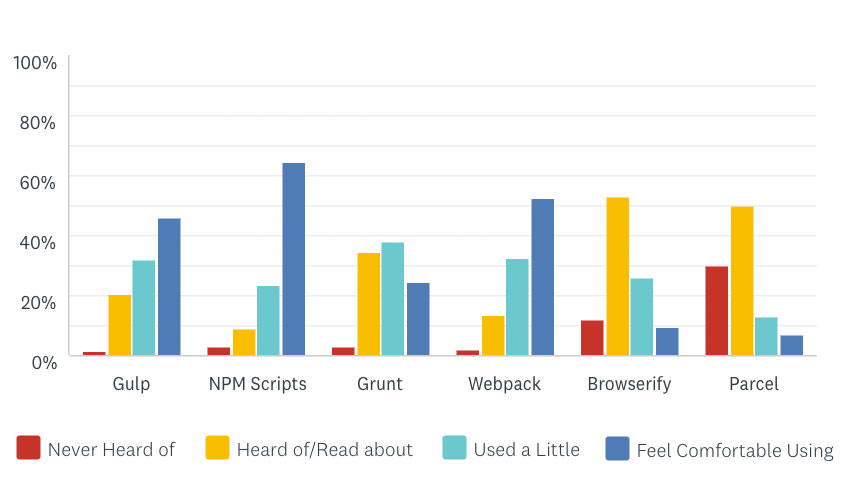
Reflecting the results in previous questions, the tools that most respondents felt comfortable using were NPM Scripts (64.39%), Webpack (52.38%) and Gulp (45.79%).
NPM Scripts and Webpack saw the biggest rises in the number of developers who now feel comfortable using them.
Parcel also saw decent growth in its usage, with both the number of respondents who have used it at least a little (12.98%, up +7.47%) and those who feel comfortable using it (7.05%, up +4.32%) rising from the 2018 results.
Q20 – JavaScript Transpilers
Over the last couple of surveys, Javascript transpilation has grown to such a level that now the vast majority of developers now use it in their workflows.
While I wouldn't expect the use of JavaScript transpilers to have dropped in the last 12 months, it is nevertheless interesting to look at its adoption levels and by how much (if at all) it's still growing.
The question asked was – Are you using a tool to transpile your JavaScript from ES6 to ES5? (i.e. Babel)
The results are as follows:
| Answer | Number of Votes | Percentage | % Diff (to 2018) |
|---|---|---|---|
| Yes | 2,451 | 81.56% | +4.80% |
| No – I’ve heard of these tools, but haven’t used one | 466 | 15.51% | -4.01% |
| No – I’ve never heard of a JavaScript transpiler | 88 | 2.93% | -0.79% |
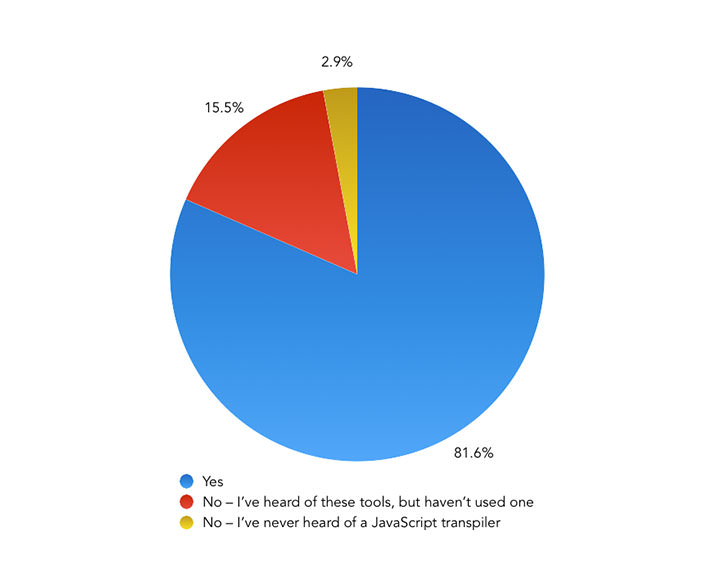
Usage of transpilers has continued to grow, with 81.56% of respondents now using one in their workflow, a rise of +4.8%.
As you might expect, developers with less experience in front-end development are less likely to be using a transpiler, with 70% of respondents with 0-2 years experience saying they did so.
Recommended Resource
Q21 – JavaScript Extension Languages
The next question was a new addition last year, looking at extension languages such as TypeScript and Flow.
TypeScript was the tool that the most respondents felt comfortable using back then, but has this changed 12 months on?
The question asked was – Please indicate your experience with the following extensions of JavaScript
Here are this year's results:
| Never Heard of | Heard of/Read About | Used a little | Feel Comfortable Using | |||||
|---|---|---|---|---|---|---|---|---|
| TypeScript | 1.16% (35) | -1.07% | 36.74% (1,104) | -11.31% | 30.18% (907) | +2.35% | 31.91% (959) | +10.03% |
| Flow | 27.92% (839) | -5.99% | 55.97% (1,682) | +5.50% | 11.78% (354) | +0.83% | 4.33% (130) | -0.34% |
| Elm | 29.42% (884) | +0.10% | 63.93% (1,921) | -0.47% | 5.36% (161) | +0.29% | 1.30% (39) | +0.09% |
| ClojureScript | 32.31% (971) | -1.24% | 65.69% (1,974) | +2.09% | 1.73% (52) | -0.65% | 0.27% (8) | -0.21% |
| Dart | 27.75% (834) | N/A | 67.62% (2,032) | N/A | 4.13% (124) | N/A | 0.50% (15) | N/A |
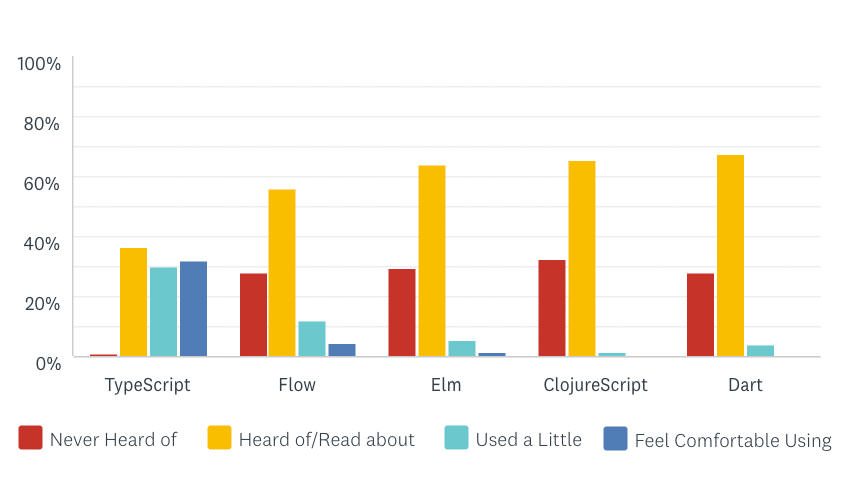
TypeScript is still the tool that the most respondents felt comfortable using, with 31.91% – a rise of +10.03% from last year's results.
There was no real change in the figures for the other tools in this category, with no real growth or decline seen.
These results seem to indicate that TypeScript is the tool that most developers are looking into when it comes to this category of tooling. While still not known by a majority of developers, it is seeing steady growth year-on-year and it'll be interesting to see if this continues in the future.
Q22 – JavaScript Linting
JavaScript linting tools are practically part of the furniture when it comes to JS workflows and last year ESLint was clearly the linter that the majority of developers were using.
The question I asked was – Which tool do you use to lint your JavaScript? (if any)
| Tool | Number of Votes | Percentage | % Diff (to 2018) |
|---|---|---|---|
| ESLint | 2,286 | 76.07% | +15.39% |
| I don’t use a JavaScript linter | 360 | 11.98% | -3.42% |
| JSLint | 143 | 4.76% | -2.44% |
| JSHint | 67 | 2.23% | -1.74% |
| StandardJS | 43 | 1.43% | -0.16% |
| Other (please specify) | 106 | 3.53% | +2.54% |
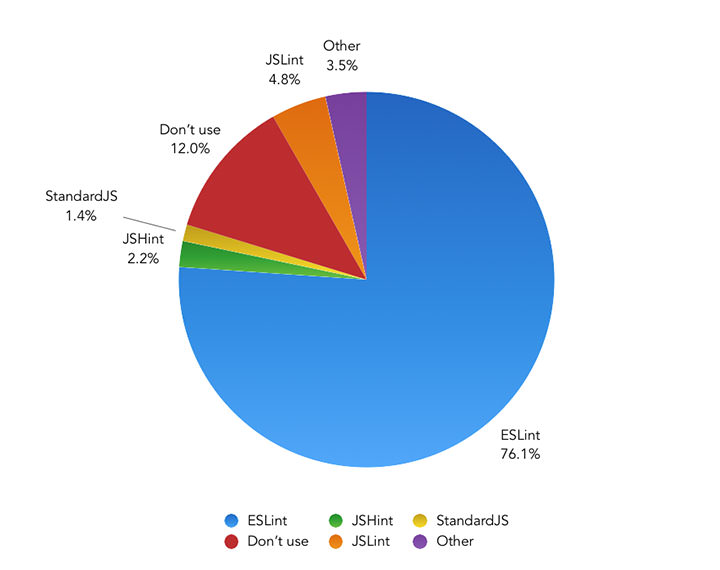
The results show a very clear trend, with ESLint usage still rising while all other linting tools seem to be trending downwards in their usage levels. 76.07% of respondents said that they use ESLint, a rise of +15.39% from last year's results.
Some of the gain in ESLint usage could be down to the TSLint team’s decision back in February to deprecate TSLint and focus their efforts on improving ESLint's TypeScript support.
The number of respondents who said that they don't use a JavaScript Linter also fell this year to 11.98%. That means that 88.02% of developers are now using a tool to help them in this area - that's a rise of 3.42% from the 84.6% of respondents that said the same 12 months ago.
So no real surprises, but further consolidation with ESLint very much considered the tool of choice in this category.
Q23 – JavaScript Testing
The next question looked at usage of JavaScript testing tools.
This year, the format of the question was changed slightly, as feedback from respondents suggested that many developers used multiple tools rather than just one. Therefore, respondents could choose multiple answers rather than just one to reflect this behaviour.
I've included the percentage difference to last year's results for reference, but due to this change in format it's likely that all of the tools will see at least a small rise in their usage.
The question asked was – Which of these tools do you use to test your JavaScript? (if any)
Here are the results:
| Tool | Number of Votes | Percentage | % Diff (to 2018) |
|---|---|---|---|
| Jest | 1,348 | 44.86% | +22.83% |
| I don’t use a tool to test my JS | 1,071 | 35.64% | -7.98% |
| Mocha | 785 | 26.12% | +12.17% |
| Jasmine | 585 | 19.47% | +8.52% |
| Enzyme | 560 | 18.64% | +16.86% |
| Cypress | 378 | 12.58% | N/A |
| QUnit | 184 | 6.12% | +1.94% |
| Ava | 102 | 3.39% | +2.25% |
| Tape | 57 | 1.90% | +0.98% |
| Other (please specify) | 109 | 3.63% | +3.63% |
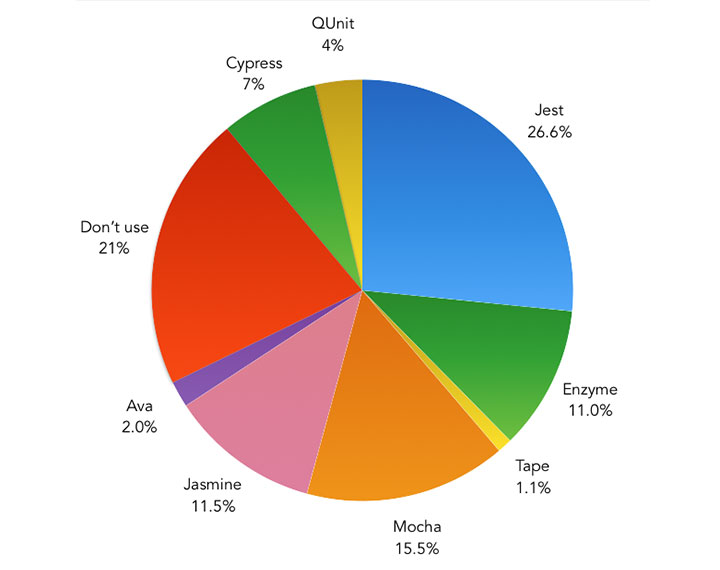
As within 2018, Jest is still the tool that most respondents are using, with 44.86%. Mocha (26.12%), Jasmine (19.47%) and Enzyme (18.64%) were the next most popular tools among respondents.
The percentage of developers using any tool to test their JavaScript rose to 64.36% – that's up +7.98% from last year's results.
I think this year's results show that there is now very broad range of tools available when it comes to JavaScript testing. Even though Jest is currently the most popular tool, there are plenty of other popular options that are worth exploring to help in this area.
Q24 – Performance Testing
The next question was a new addition to find out how developers are building with performance in mind on their projects.
There are now so many tools and native features available when it comes to page performance, I was intrigued to see which ones are being used the most across the community.
The question I asked was Which of these tools, libraries or language features do you use to help with performance? (if any). Respondents could choose one or more of the options listed.
Let's take a look at the results:
| Tool | Number of Votes | Percentage |
|---|---|---|
| Lighthouse | 1,566 | 52.11% |
| None of these tools | 952 | 31.68% |
| WebPageTest | 730 | 24.29% |
| Service Workers | 695 | 23.13% |
| Pingdom | 317 | 10.55% |
| AMP (Accelerated Mobile Pages) | 174 | 5.79% |
| Other (please specify) | 109 | 3.63% |
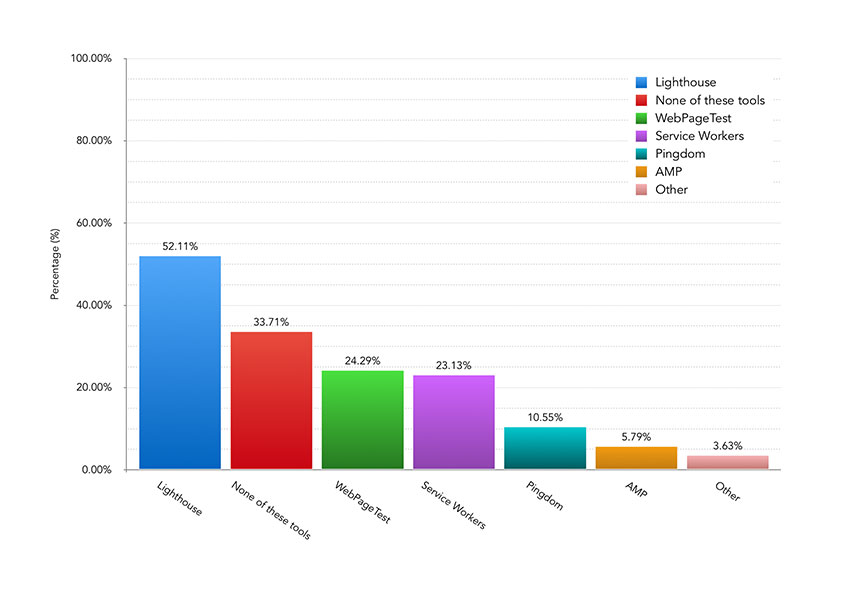
Lighthouse was the most popular option with respondents, with 52.11% saying that they used it when performance tetsing.
Surprisingly, the second most popular option was "None of these tools", with 31.68% of respondents saying that they didn't use any of the tools or features mentioned.
Of the other available options, 24.29% of developers said that they used WebPageTest and 23.13% of developers said that they were using Service Workers on their projects.
It's also interesting to see that just 5.79% of developers said that they were implementing AMP (Accelerated Mobile Pages) on their projects. Given how hard Google has pushed for the implementation of AMP over the last few years, it seems that it's still fairly niche when it comes to usage levels among respondents.
Q25 – Accessibility Testing
Another new question for this year's survey, this looked to find out usage levels of accessibility testing tools among respondents.
The question asked was Which of these accessibility tools do you use to test your sites/applications?. Respondents could choose one or more of the options specified.
Here are the results:
| Tool | Number of Votes | Percentage |
|---|---|---|
| I don't use any tools to accessibility test my sites/applications | 1,897 | 63.13% |
| Colour Contrast Checker (i.e. contrastchecker.com) | 667 | 22.20% |
| Screenreader (i.e. JAWS, Voiceover) | 464 | 15.44% |
| WAVE | 285 | 9.48% |
| Other (please specify) | 282 | 9.38% |
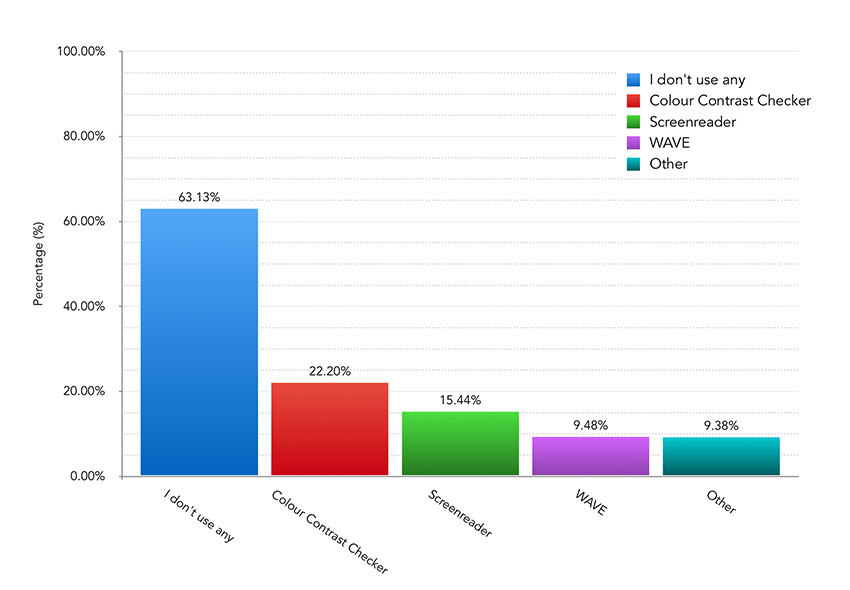
Somewhat surprisingly, 63.13% of respondents said that they didn't use any tools to accessibility test their projects.
22.20% of respondents said that they were using a colour contrast checker and just 15.44% said that they used a screenreader for accessibility testing.
I have to say, these figures make for extremely depressing reading.
Looking at raw figures like this takes away the context of why people aren't using these tools, but as someone who believes that everyone deserves access to the sites that we're building, to see that almost two thirds of developers aren't using a tool to accessibility test their projects is disappointing.
Tools like Wave and Axe (mentioned by quite a few respondents under 'Other Tools') are extremely easy to use and I'd highly recommend checking them out if you haven't already done so.
Hopefully, the more exposure that we can give to the value and ease of using these tools, the more that these usage figures are likely to rise among developers.
Q26 – JavaScript Package Managers
The penultimate question of this year's survey was in relation to JS Package Managers, with the question being – Which JavaScript package manager do you primarily use in your workflow?
Last year, NPM was the most popular package manager, but has Yarn gained any ground over the last 12 months?
This is how people responded:
| Answer | Number of Votes | Percentage | % Diff (to 2018) |
|---|---|---|---|
| NPM | 1,965 | 65.39% | +2.00% |
| Yarn | 895 | 29.78% | -0.36% |
| I don’t use a package manager | 135 | 4.49% | -1.24% |
| Other | 10 | 0.33% | -0.40% |
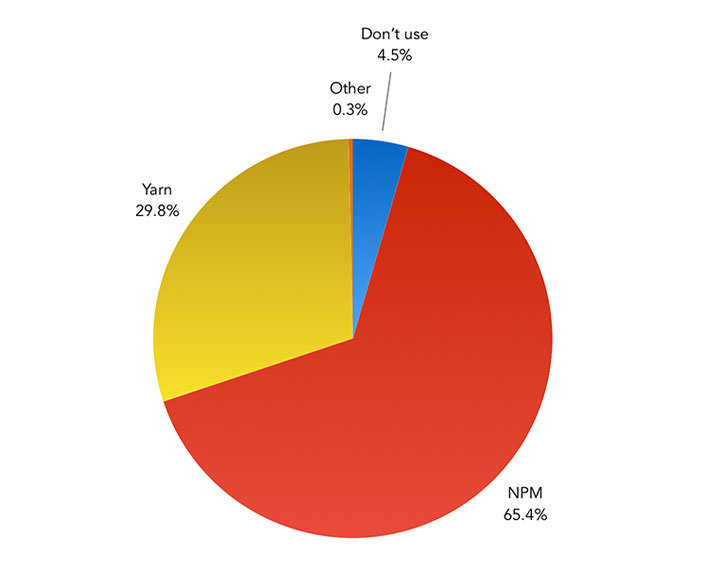
Looking at the results, NPM usage has grown very slightly with 65.39% of respondents saying that they now use it.
Usage of Yarn stayed pretty static, with it falling a small percentage to 29.78%.
Overall, the majority of people seem to be happy using NPM as their package manager, with no real change being observed in this category when compared to last year's figures.
Q27 – Miscellaneous Tools
The final question looked at knowledge levels across various front-end tools (some of which didn't quite fit into any of the categories that had been asked about previously).
Respondents were asked to – Please indicate your experience with the following front-end tools.
Here is how people responded:
| Never Heard of | Heard of/Read About | Used a little | Feel Comfortable Using | |||||
|---|---|---|---|---|---|---|---|---|
| NPM | 0.43% (13) | -0.41% | 1.80% (54) | -0.69% | 10.75% (323) | -1.14% | 87.02% (2,615) | +2.24% |
| Yarn | 3.29% (99) | -2.95% | 22.30% (670) | -4.21% | 23.79% (715) | +2.84% | 50.62% (1,521) | +4.32% |
| Babel | 2.70% (81) | -1.07% | 16.71% (502) | -4.22% | 30.98% (931) | +1.22% | 49.62% (1,491) | +4.08% |
| Prettier | 15.67% (471) | -14.76% | 21.60% (649) | -8.03% | 22.30% (670) | +6.25% | 40.43% (1,215) | +16.53% |
| Yeoman | 24.76% (744) | +5.63% | 40.67% (1,222) | -1.18% | 26.69% (802) | -3.07% | 7.89% (237) | -1.37% |
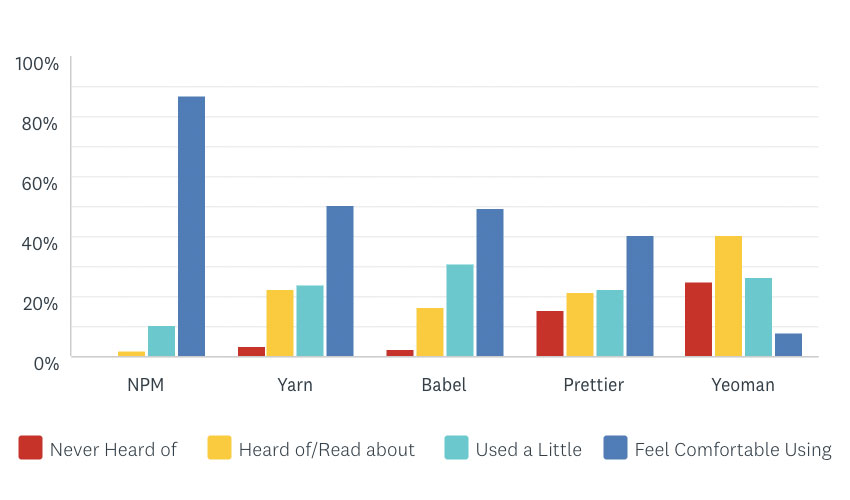
Out of these tools, NPM is the one that the most respondents say they feel comfortable using (87.02%). Yarn, with 50.62%, and Babel, with 49.62%, were the next most familiar tools with developers, with both of these tools seeing small rises in developer knowledge levels over the last 12 months.
The biggest change from last year's results was the number of respondents who now feel comfortable using Prettier, with this percentage rising 16.53% to 40.43% of respondents.
Yeoman knowledge levels dropped slightly, a trend that was also observed last year.
Summary
So there we have it – another interesting year in tooling!
In some areas of tooling, developers are clearly consolidating around one tool. ESLint, NPM Scripts and Webpack for instance when it comes to JavaScript linting, task running or module bundling respectively.
Looking at JavaScript frameworks and libraries, React maintained its position as the most essential framework among respondents, with respondents naming Vue.js as the next most essential JS framework/library. A large percentage of developers (21.66%) still see no single framework or library as essential, with native JS becoming more capable each year.
The most shocking figure in this year's results came in relation to accessibility testing, with 63.13% of respondents saying that they don't use any tool to accessibility test their projects. As an industry, we have to do much better than this – not just because it's the right thing to do morally, but also from a legal perspective with accessibility lawsuits becoming more commonplace.
In terms of CSS tooling, Sass is still the most popular CSS Processor but Bootstrap has fallen in popularity slightly, with most developers now choosing not to use any CSS framework on their projects.
The number of developers now linting their CSS and using a CSS naming scheme now outweigh those that don't, with 53.21% using a CSS linter and 52.08% using a CSS naming scheme.
CSS-in-JS continues to grow at a steady rate too, with 44.69% of developers now saying that they use a CSS-in-JS tool.
Overall, I think it's encouraging that consolidation appears to be happening as our front-end tooling becomes more mature. As more powerful tools emerge, the need to supercede these is less prevalent and I think we're seeing proof of this in these results.
Across the majority of tooling categories there are now clear leaders – something that wasn't true a few years ago. This helps with knowledge churn, potentially making it easier for developers of all levels to know where it's best to invest their time when picking up new tools, which can only be a good thing.
Thanks again to everyone who took part this year.
If anyone has any questions about any of the results, message me on Twitter and I’ll do my best to help.
Also, if you'd like to receive emails about when the next survey is launched, feel free to sign up below.
Article posted on the 12th November 2019